Enhanced information into new Analytics dashboard view\query "Average Login Duration"
Would be great to enhance this so it's aligned with the native portal insights where the average login duration is broken down into stages.
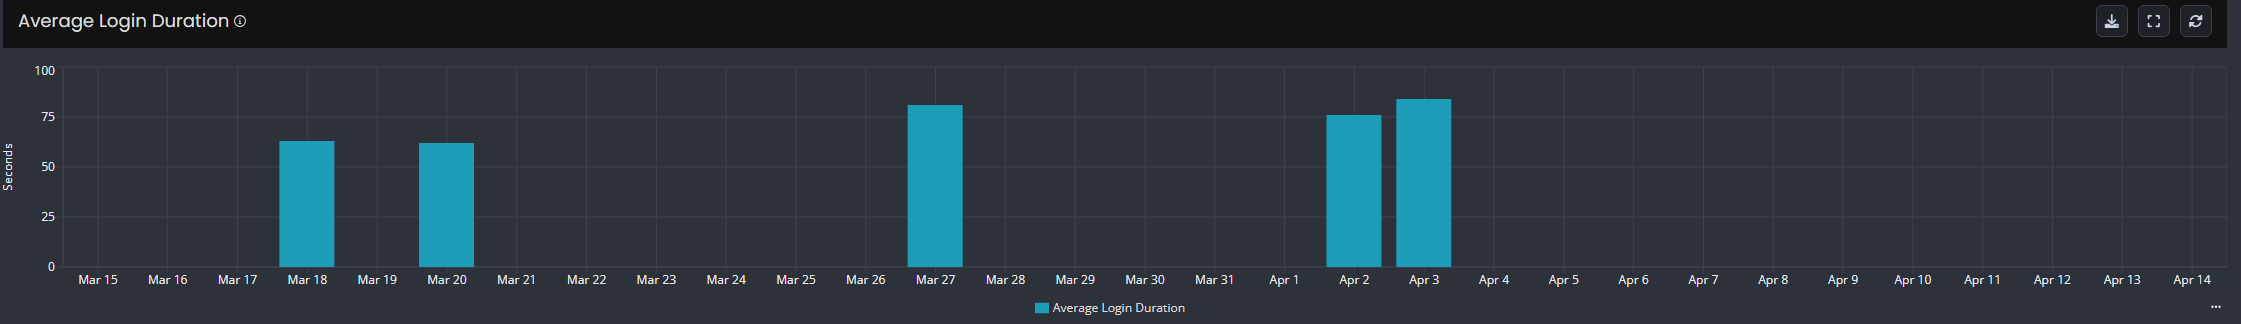
For example, showing percentage of login duration based on Authentication, GPO, FSLogix, brokering session, etc etc
This will give valuable information\insights to allow for investigating and improving end user experience of AVD
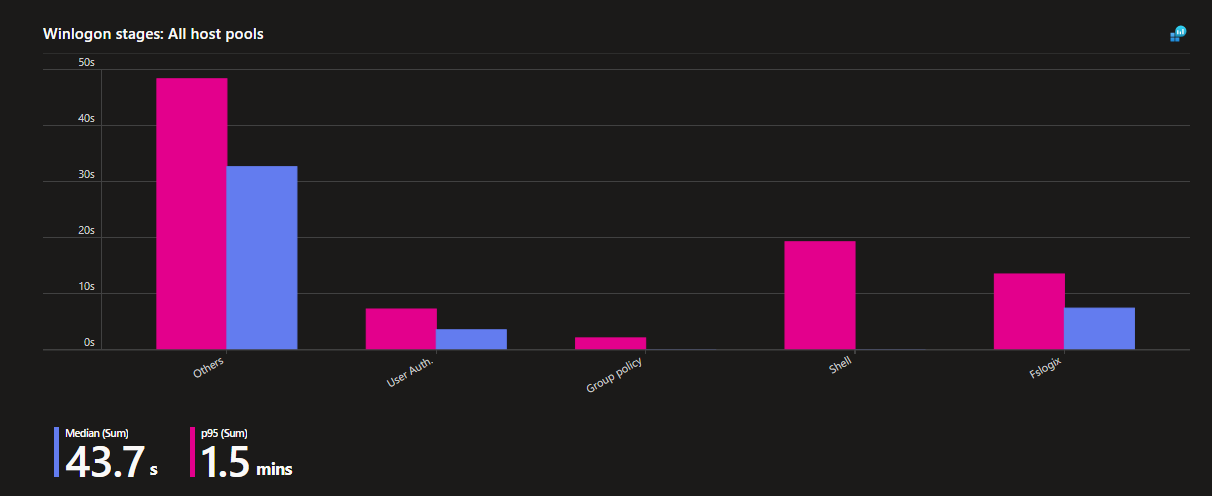
The KQL for that can be utilized for a breakdown of stages of logon duration:
let newSessions = true;
let renameStage = (stage: string) {
case(
stage =~ "frxsvc",
"Fslogix",
stage =~ "GPClient",
"Group policy",
stage =~ "WinLogon_StartShell",
"Shell",
stage =~ "AuthenticateUser",
"User Auth.",
"Others"
)
};
WVDConnections
| where State == "Connected"
| where TimeGenerated between(datetime("2025-03-16T10:37:35.000Z") .. datetime("2025-04-14T10:37:35.000Z"))
| where ("no_hostpool_selected" == "no_hostpool_selected" or _ResourceId == "no_hostpool_selected")
| join kind = leftsemi
(
// Only include connections that actually reached the host to prevent short (failed) attempts from skewing the data
WVDCheckpoints
| where Source == "RDStack" and Name == "RdpStackConnectionEstablished"
)
on CorrelationId
| join kind = leftsemi
(
WVDCheckpoints
| where Name == "LoadBalancedNewConnection"
| extend LoadBalanceOutcome=Parameters.LoadBalanceOutcome
| where (newSessions and LoadBalanceOutcome == "NewSession") or (not(newSessions) and LoadBalanceOutcome in ('Disconnected', 'Active'))
)
on CorrelationId
| project TimeGenerated, CorrelationId, UserName, SessionHostName
| join kind=inner
(
WVDCheckpoints
| where Name == "LogonDelay"
)
on CorrelationId
| extend
Type = tostring(Parameters.LogonType),
Parameters = bag_remove_keys(Parameters, dynamic(["LogonType", "WinLogonPid"]))
| mv-expand bagexpansion=array Parameters
| extend Stage = tostring(Parameters[0]), Time = toreal(Parameters[1]) / 1000
| where Stage != "WinLogon_Total" and Stage != "WinLogon_Logon"
| extend Stage = renameStage(trim_start("WinLogon_Logon_", Stage))
| summarize Time=sum(Time), TimeGenerated=min(TimeGenerated) by Stage, UserName, SessionHostName, _ResourceId
| summarize (Median, p95) = percentiles(Time, 50, 95) by Stage
(I had raised this last year, wanting to elevate this with additional info\images: Enhanced information into new Analytics dashboard view\query "Average Login Duration" broken down into stages\process contributing to this data – Nerdio Manager for Enterprise)
Comments (4 comments)